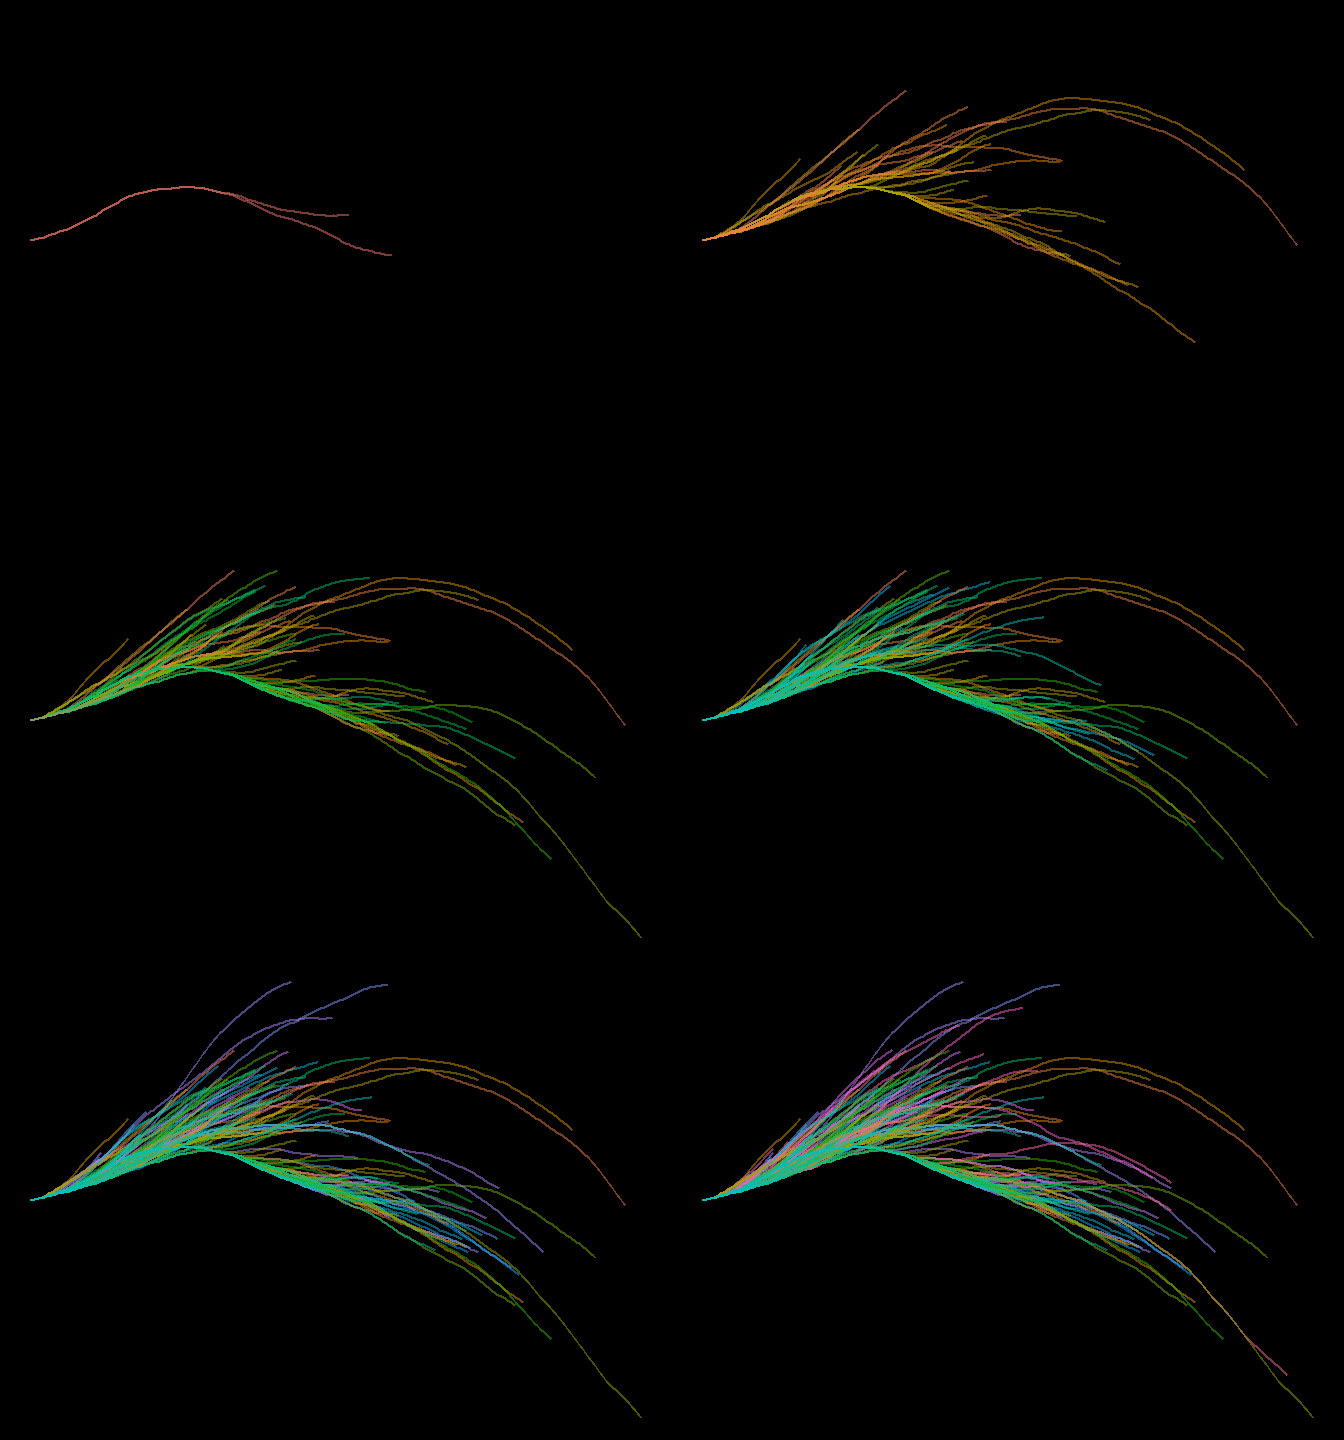
The Collatz Conjecture
The inspiration for a series of posts on generative art was a post I read announcing the aRtsy package for producing generative art. A number of the example canvases looked nice, so I installed the package from the author’s GitHub repository. The first canvas I tried was canvas_collatz(), but for whatever reason, instead of the canvas as shown in the example below, it produced just one wavy line.

I looked into the source code in the repo to see if I could tell what was going wrong, but the R scripts were calling functions that I couldn’t find. So then I thought, why not just write my own script to create the art?
Collatz Conjecture
Between the Wikipedia page for the Collatz conjecture and the aRtsy package description, I thought I had enough to go on. First, I started with generating just one number sequence. The process is this.
- Randomly choose a positive integer.
- If it’s even, divide by two.
- If it’s odd, multiply by three and add one.
Repeat 2 and 3 and keep track of the sequence of numbers. The Collatz conjecture states that no matter what number you start with, the sequence will always reach the number 1. So, once the sequence reaches 1, stop the sequence. Let’s do it!
set.seed(1)                # 1 seems appropriate for this problem

n <- sample(2:1000000, 1)  # choose a random number between 2 and one million
ns <- n                    # add it to the sequence

while (n > 1){             # stop the sequence when we reach 1
  if(n %% 2 == 0){         # check if the number is even
    n <- n / 2             # divide by 2
    ns <- c(ns, n)         # add it to the sequence
  }else{                   # if it's odd
    n <- 3*n + 1           # do the math
    ns <- c(ns, n)}        # add it to the sequence
}

ns
##   [1]  548677 1646032  823016  411508  205754  102877  308632  154316   77158
##  [10]   38579  115738   57869  173608   86804   43402   21701   65104   32552
##  [19]   16276    8138    4069   12208    6104    3052    1526     763    2290
##  [28]    1145    3436    1718     859    2578    1289    3868    1934     967
##  [37]    2902    1451    4354    2177    6532    3266    1633    4900    2450
##  [46]    1225    3676    1838     919    2758    1379    4138    2069    6208
##  [55]    3104    1552     776     388     194      97     292     146      73
##  [64]     220     110      55     166      83     250     125     376     188
##  [73]      94      47     142      71     214     107     322     161     484
##  [82]     242     121     364     182      91     274     137     412     206
##  [91]     103     310     155     466     233     700     350     175     526
## [100]     263     790     395    1186     593    1780     890     445    1336
## [109]     668     334     167     502     251     754     377    1132     566
## [118]     283     850     425    1276     638     319     958     479    1438
## [127]     719    2158    1079    3238    1619    4858    2429    7288    3644
## [136]    1822     911    2734    1367    4102    2051    6154    3077    9232
## [145]    4616    2308    1154     577    1732     866     433    1300     650
## [154]     325     976     488     244     122      61     184      92      46
## [163]      23      70      35     106      53     160      80      40      20
## [172]      10       5      16       8       4       2       1
Creating Art
Ok, now that I have a sequence of numbers, how do I turn that into a line? According to the description in the GitHub repo, by “bending the edges differently for even and odd numbers in the sequence”. I wasn’t certain exactly meant in terms of code, but my first thought was just to do a little trigonometry and follow these steps:
- Reverse the sequence in order to start with 1.
- Also pick a starting angle - I chose 0.
- For the first number (1), assign it the (x, y) coordinates of (0, 0).
- Look at the next number in the sequence.
- If it’s even, update the angle by: i) new angle = old angle + 0.0075
- If it’s odd, update the angle by: i) new angle = old angle - 0.0145
- Calculate the next coordinate by: i) new x = old x + cos(new angle) ii) new y = old y + sin(new angle)
Repeat steps 3-6 for the rest of the sequence. The following code does the trick.
even_angle = 0.0075
odd_angle = 0.0145

df <- data.frame(n = rev(ns)) # dataframe to store coordinates

angle <- 0
x <- rep(1, length(ns))       # initialize x coords with 1's
y <- rep(1, length(ns))       # same for y coords

for (i in 2:length(ns)){
  if (ns[i] %% 2 == 0){       # check for even number
    angle <- angle + even_angle
    x[i] <- x[i-1] + cos(angle)
    y[i] <- y[i-1] + sin(angle)
  }else{
    angle <- angle - odd_angle
    x[i] <- x[i-1] + cos(angle)
    y[i] <- y[i-1] + sin(angle)}
}
df$x <- x
df$y <- y

head(df)
##    n        x        y
## 1  1 1.000000 1.000000
## 2  2 1.999972 1.007500
## 3  4 2.999859 1.022499
## 4  8 3.999606 1.044997
## 5 16 4.999156 1.074993
## 6  5 5.999036 1.090492
Let’s see how that looks in a plot.
library(ggplot2)

theme_set(theme_bw())

ggplot(df) +
  geom_line(aes(x=x, y=y))

That looks promising, so now I’ll generate 200 sequences the same way. I’ll number each sequence 1-200 as I create them and store the sequence number in column named gp.
set.seed(1)

for (i in 1:200){
  n <- sample(2:1000000, 1)
  ns <- n

  while (n > 1){
    if(n %% 2 == 0){
      n <- n / 2
      ns <- c(ns, n)
    }else{
      n <- 3*n + 1
      ns <- c(ns, n)}
  }
  ifelse(i == 1,
         df <- data.frame(n = rev(ns), gp = i),
         df <- rbind(df, data.frame(n = rev(ns), gp = i)))
}
Next I generate all of the coordinates for each sequence.
df$x <- 0
df$y <- 0

for (j in 1:200){
  angle <- 0
  sq <- df[df$gp == j, "n"]
  x <- rep(1, length(sq))
  y <- rep(1, length(sq))
  for (i in 2:length(sq)){
    if (sq[i] %% 2 == 0){
      angle <- angle + even_angle
      x[i] <- x[i-1] + cos(angle)
      y[i] <- y[i-1] + sin(angle)
    }else{
      angle <- angle - odd_angle
      x[i] <- x[i-1] + cos(angle)
      y[i] <- y[i-1] + sin(angle)}
  }
  df[df$gp == j, "x"] <- x
  df[df$gp == j, "y"] <- y
}

head(df)
##    n gp        x        y
## 1  1  1 1.000000 1.000000
## 2  2  1 1.999972 1.007500
## 3  4  1 2.999859 1.022499
## 4  8  1 3.999606 1.044997
## 5 16  1 4.999156 1.074993
## 6  5  1 5.999036 1.090492
This time, instead of ggplot2, I’m going to use plotly to create the graphic because it might be interesting to zoom in on different parts of the plot. I’m going to hide all of the axis labels, grid lines, etc. so that the final plot looks more like a canvas. I’ll also apply the Spectral color palette from RColorBrewer and make the background black.
library(plotly)
library(RColorBrewer)

noax <- list(
  title = "",
  zeroline = FALSE,
  showline = FALSE,
  showticklabels = FALSE,
  showgrid = FALSE
)

df %>% mutate(gp = factor(gp)) %>%
  plot_ly() %>%
  add_lines(x=~x, y=~y, color=~gp, colors = colorRampPalette(brewer.pal(11, "Spectral"))(200),
            hoverinfo = "none",
            opacity = 0.5, showlegend = FALSE) %>%
  layout(xaxis = noax,
         yaxis = noax,
         paper_bgcolor = "#000000", plot_bgcolor = "#000000")
The images this algorithm generates remind me of feathers, flowers, or grass. Maybe animating the plot would produce an interesting effect.
library(dplyr)
library(gganimate)

df %>%
  mutate(frame = row_number()) %>%
  ggplot() +
  geom_line(aes(x=x, y=y, group=gp, color=factor(gp)), size = 1, alpha=0.5) +
  scale_fill_distiller(palette = "Spectral") +
  theme_void() +
  theme(panel.background = element_rect(fill = 'black', color = 'black'),
        legend.position = "none") +
  transition_reveal(gp)

It seemed to me that there are a number of knobs one could turn to get different effects, like the seed, the number of sequences, the amount of bend in the lines, and the choice of color palettes. So, I made a Shiny App for this and other generative art algorithms.


Comments